The Federal Reserve released the 2025 Survey of Consumer Finances (SCF) this month. This survey provides insight into how American households hold their wealth, including cash, retirement accounts, homes, business equity, and debt. The survey is conducted every three years. The summary PDF is available here.
Unfortunately, the report contains only median net worth by age group, while I wanted to look at p25, p50, p75, p90, p95 and p99 values by age group.
Processing the Data
To get this data, I downloaded the raw CSV here (you can find this link in the Summary Extract Public Data table). The file contains three important columns for us:
AGE: the age (in years) of the survey respondent, specifically the head of household as defined by the SCF. It’s the variable the scripts bucket/fit against.
NETWORTH: total assets (financial assets, real estate, business equity, vehicles, retirement accounts, etc.) minus total debt (mortgages, credit cards, loans).
WGT: the survey weight for that respondent, representing how many actual U.S. households they statistically stand in for. Needed because the SCF deliberately oversamples wealthy households, so weighting makes the sample representative of the population.
I then used Claude to write a Python script: https://github.com/stockclubs-io/survey-of-consumer-finances-2025/blob/main/networth_by_age.py
The script gave me the following data:
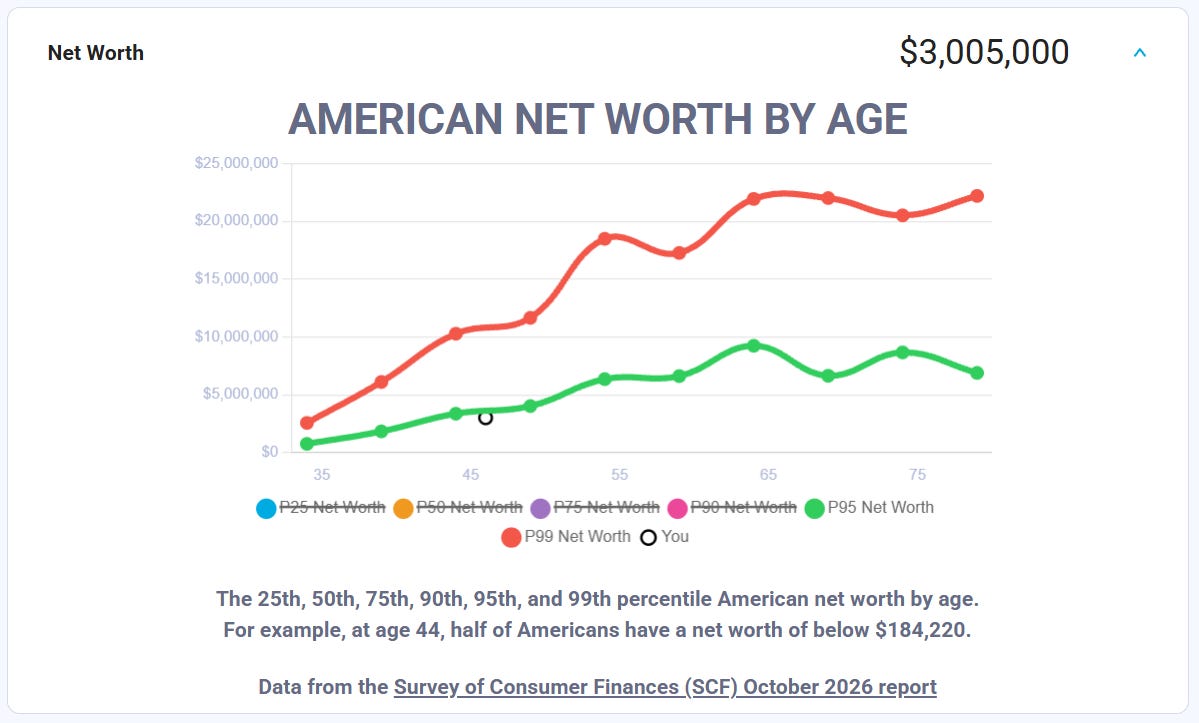
The raw 5-year bucket calculations work, but they are noisy at the extremes because each bucket contains too few respondents. This creates anomalies on the chart: the 95th percentile swings by millions between ages 60 and 80, while the 25th percentile dips unexpectedly at ages 55–59.
Household wealth doesn’t fluctuate that wildly in 5-year intervals. These spikes and drops are statistical sampling noise, not genuine economic trends.
Smoothing the Data: Weighted Quantile Regression with Flexible Splines
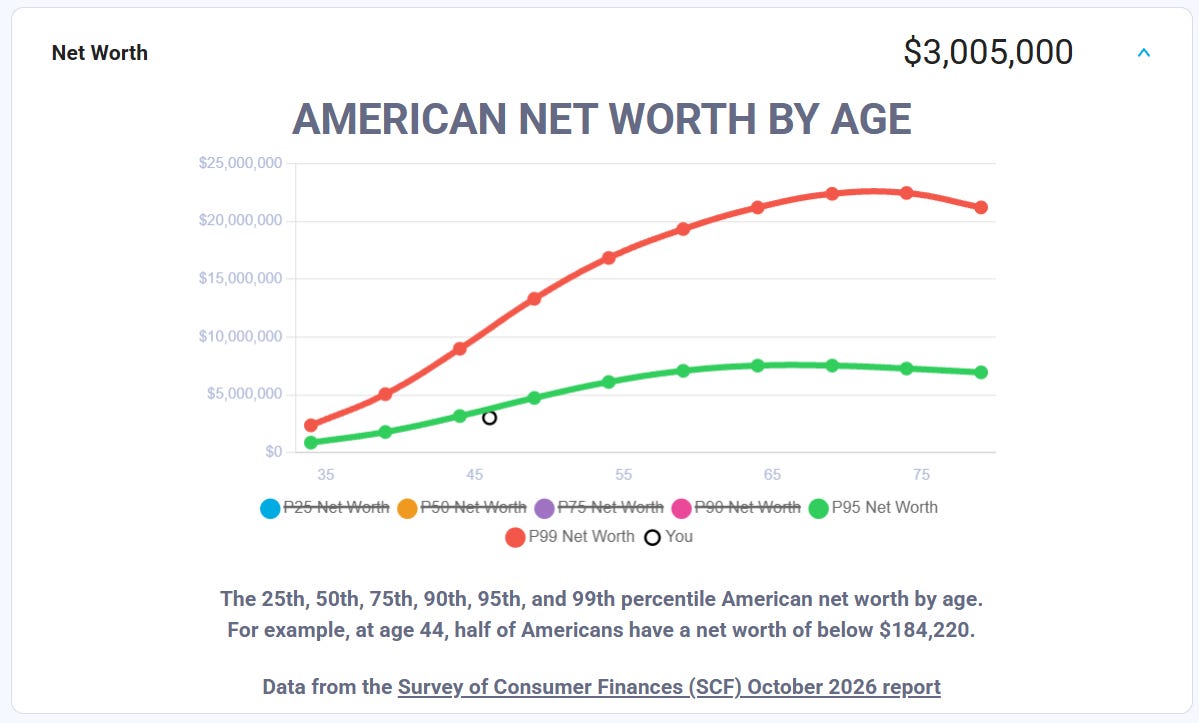
To eliminate the sampling noise of isolated 5-year buckets, I switched to weighted quantile regression using B-splines.
Instead of dividing respondents into 5-year age groups, this approach treats age as a continuous spectrum. The flexible splines (specifically, cubic B-splines) act like a flexible curve anchored at demographic milestones, allowing smooth, organic curves to take shape across lifetimes rather than forcing the data into straight lines.
Meanwhile, weighted quantile regression fits curves directly to each percentile threshold, from p25 up to p99, while applying the Fed’s survey weights so every household represents its real share of the U.S. population.
The code is here: https://github.com/stockclubs-io/survey-of-consumer-finances-2025/blob/main/networth_by_age_smoothed.py
Evaluating these continuous curves at the midpoint of each 5-year bracket irons out spikes and drops, leaving a realistic trajectory of American net worth:
What has changed since 2022?
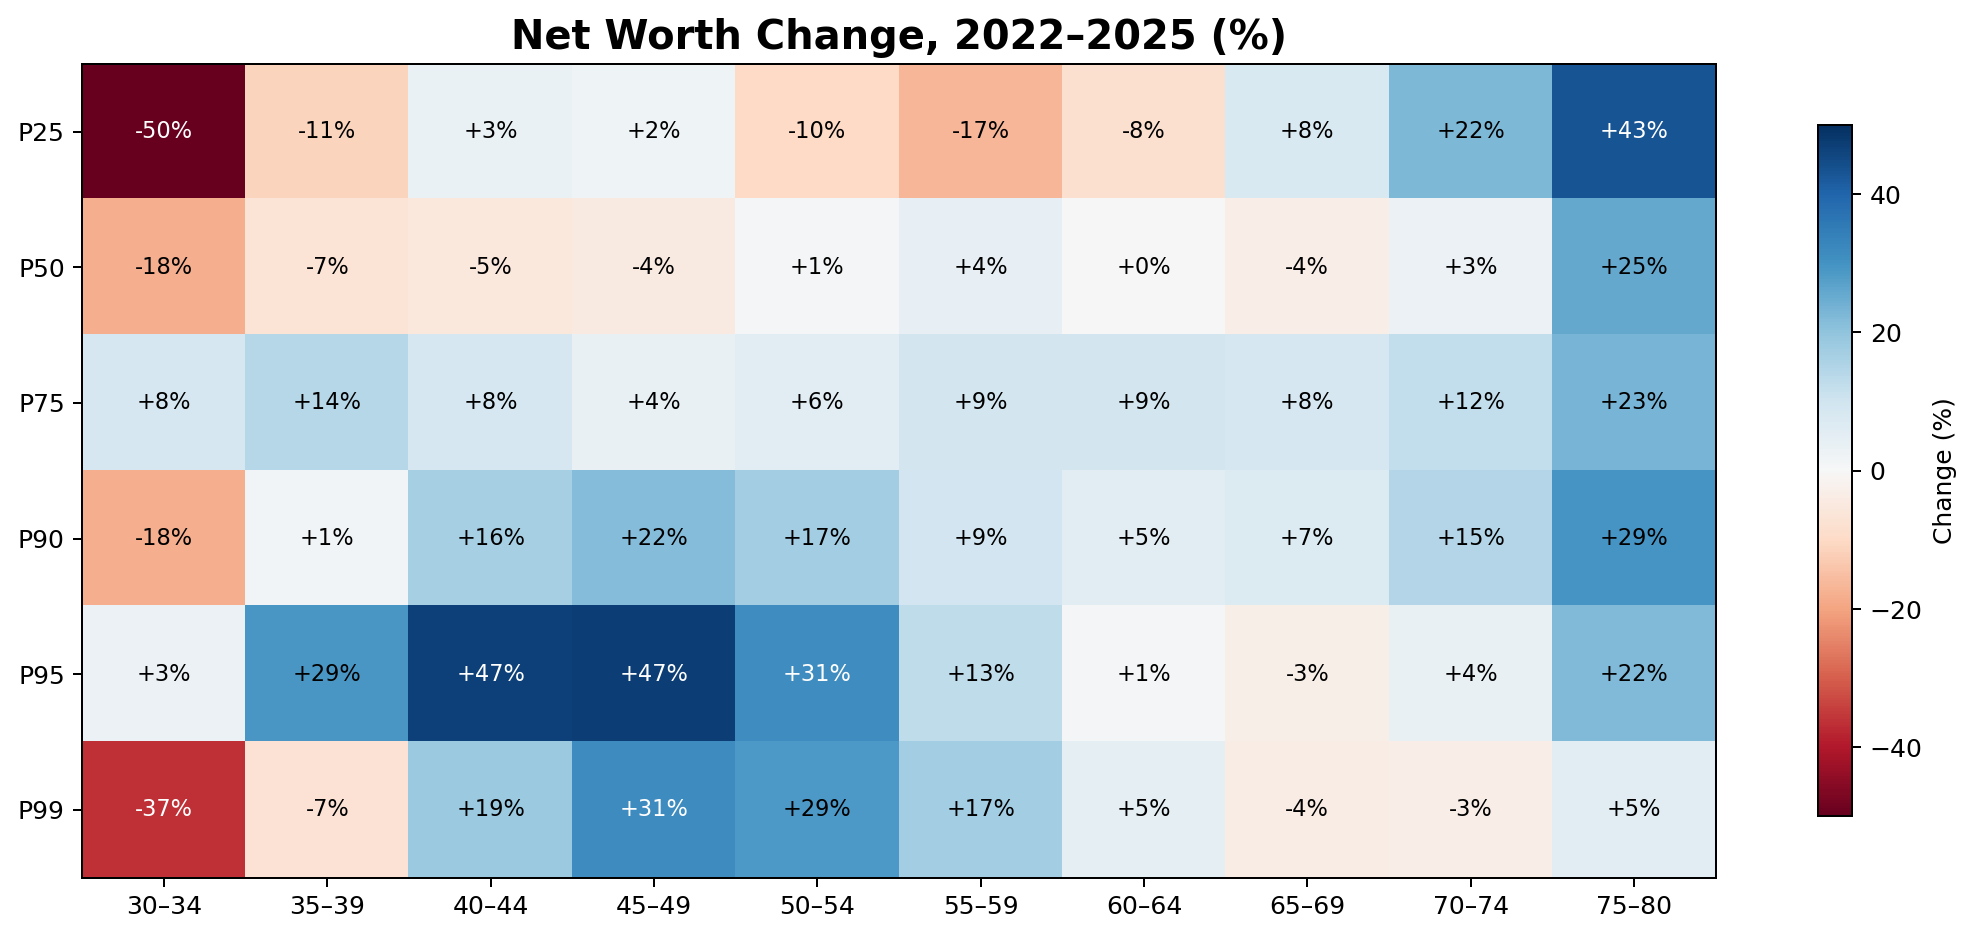
Comparing net worth data from 2022 and 2025 shows an interesting trend: wealth growth has been uneven across age groups and net worth percentiles.
While wealthier households generally saw their net worth increase, households closer to the median experienced little growth or even declines. Both datasets express net worth in inflation-adjusted 2025 dollars, allowing us to compare changes in purchasing power directly.
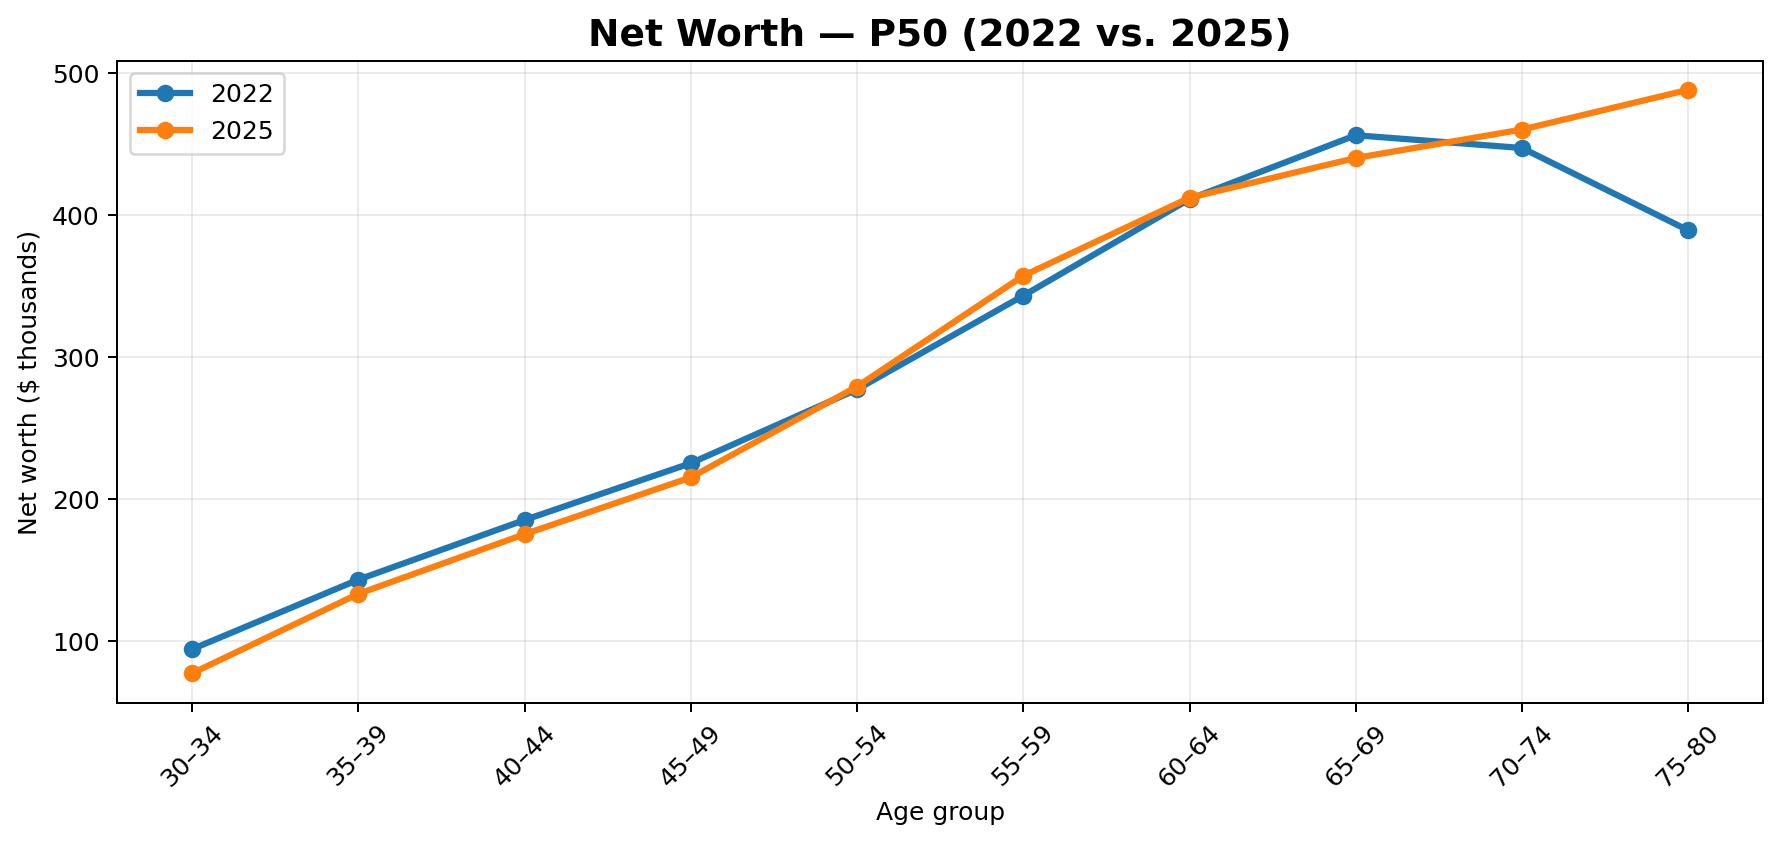
Median net worth has largely stagnated. For households between ages 30 and 49, median net worth declined between 4% and 18%. For households aged 50–74, median net worth remained relatively flat.
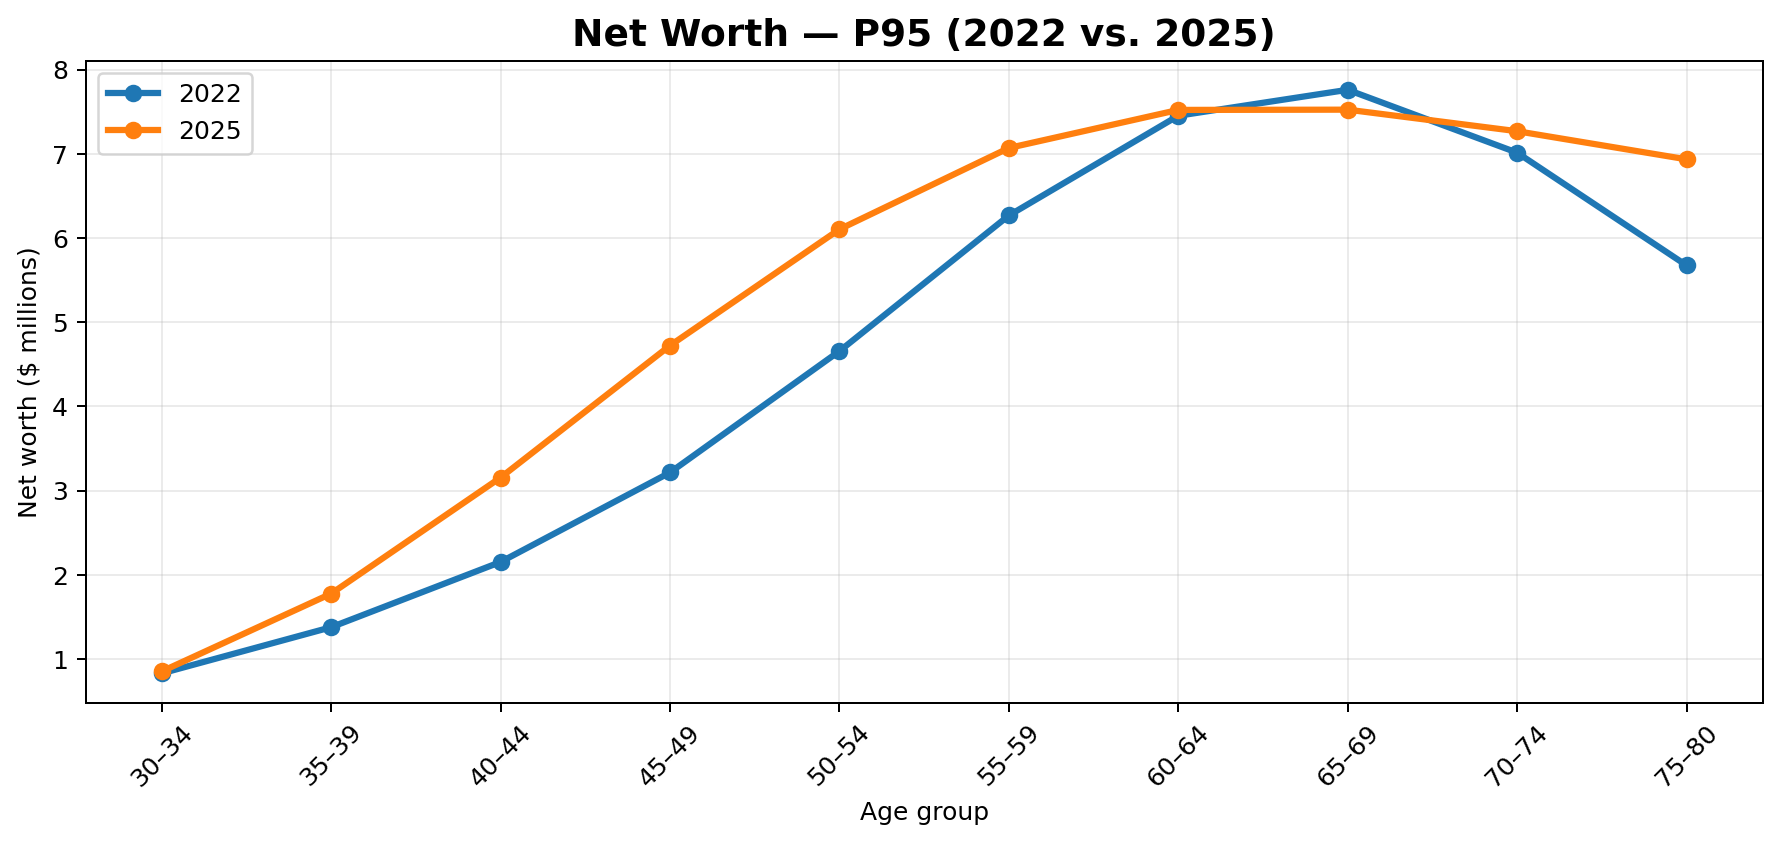
Wealthier households, especially those in their 40s and 50s, experienced substantial gains. The 95th percentile saw some of the largest increases:
Ages 40–44: from $2.15M to $3.15M (+47%)
Ages 45–49: from $3.21M to $4.72M (+47%)
Ages 50–54: from $4.66M to $6.10M (+31%)
Ages 55–59: from $6.27M to $7.07M (+13%)
The 99th percentile also increased substantially for households in their 40s and 50s, although gains were less consistent across other age groups.
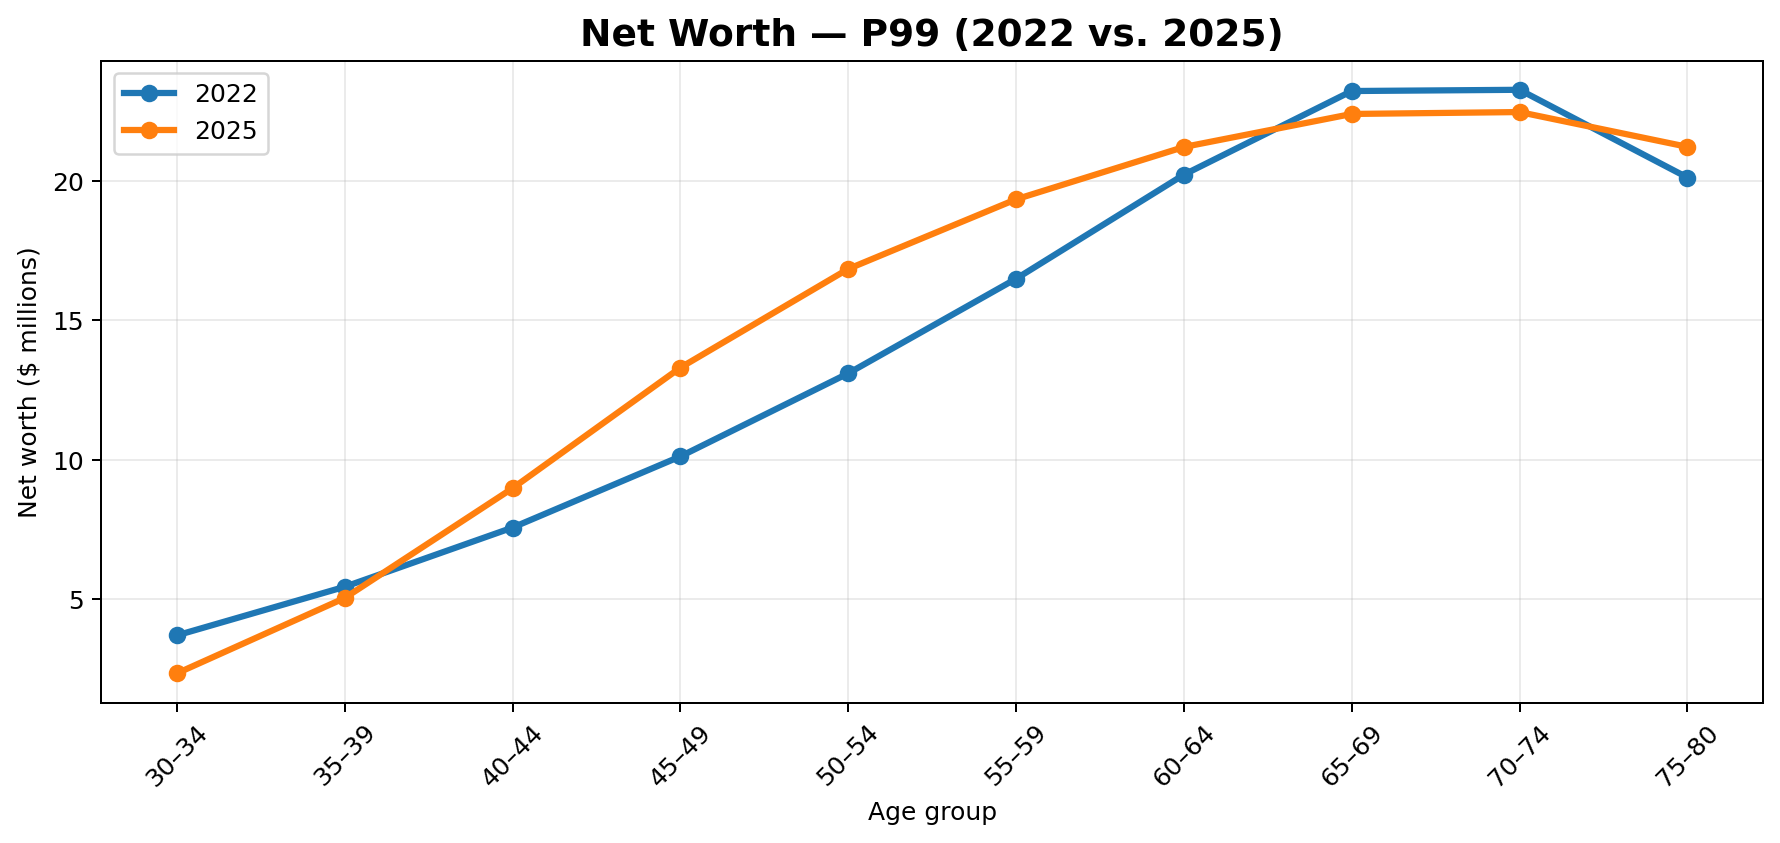
The gap between median and wealthy households has widened. For households aged 45–49, median net worth (P50) declined from $225,000 in 2022 to $215,000 in 2025, a decrease of 4.4%. Meanwhile, the 95th-percentile net worth (P95) increased from $3.21 million to $4.72 million, a gain of 46.9%. As a result, the ratio between P95 and median net worth increased from 14.3x in 2022 to 22.0x in 2025, representing a 53.8% increase.
A similar pattern appears among households aged 40–44, where the ratio increased from 12x to 18x.
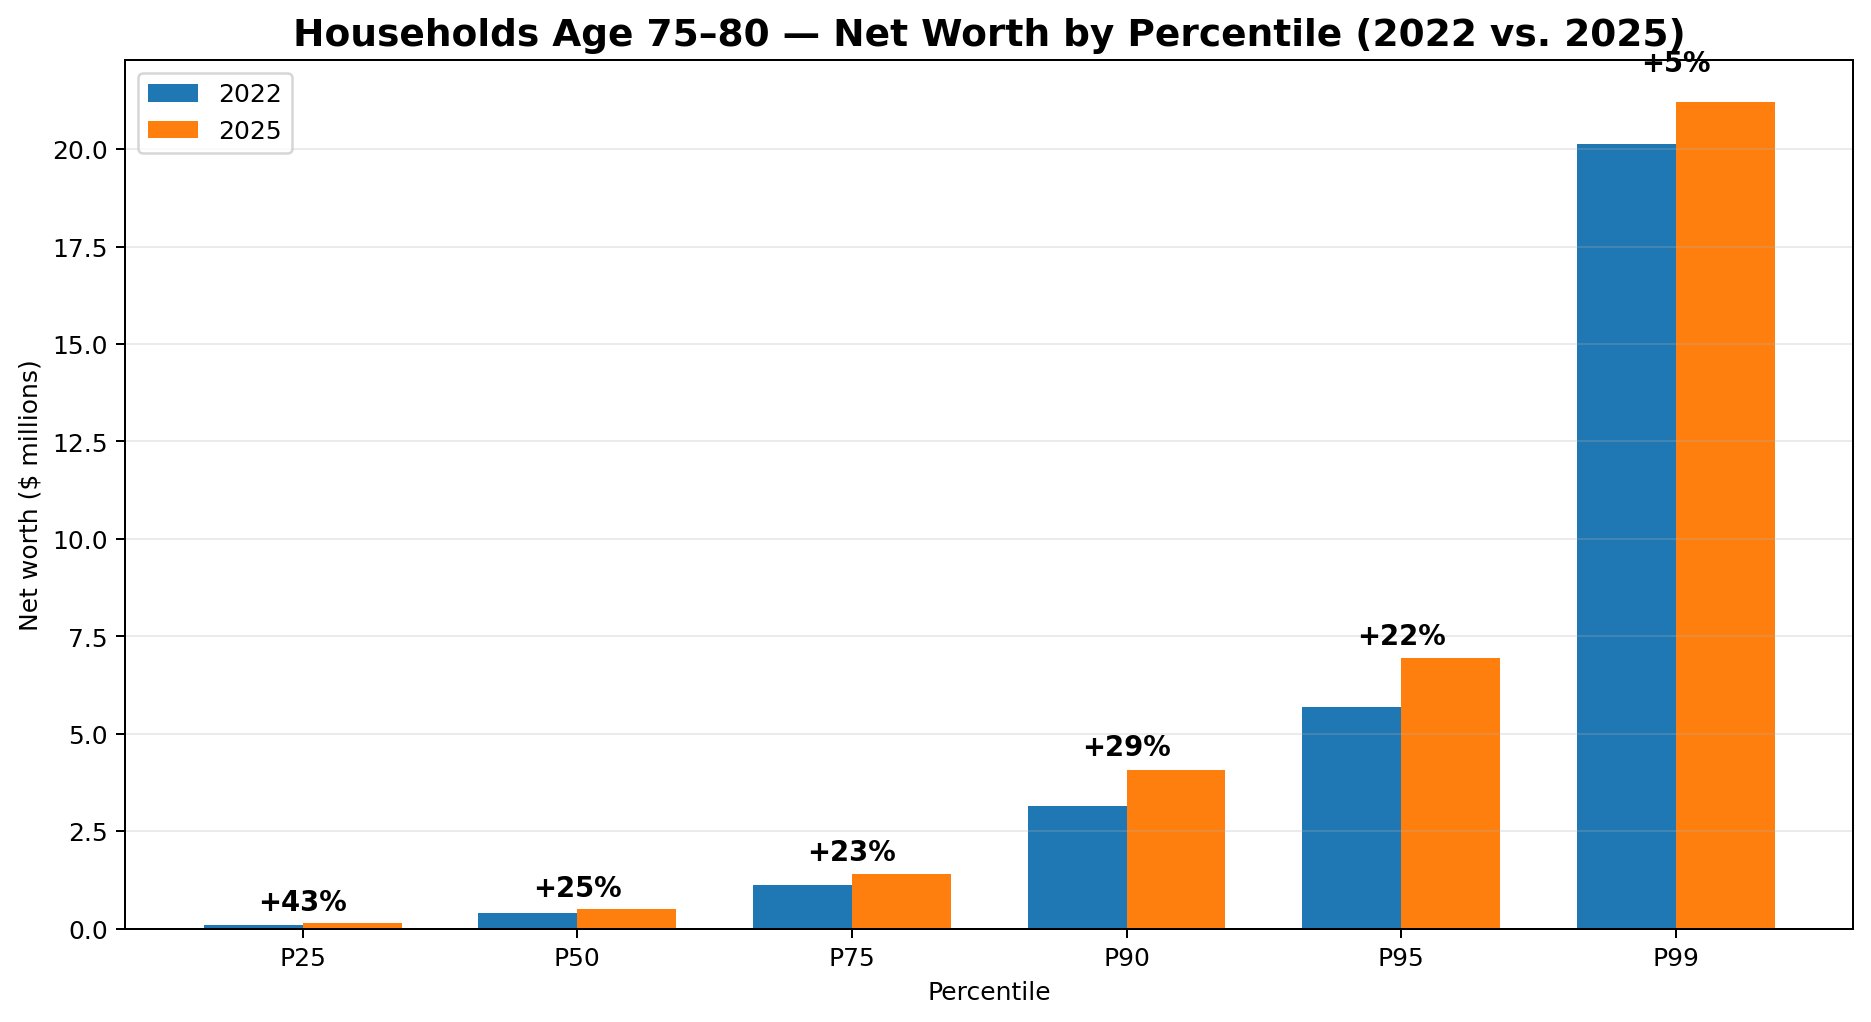
Households aged 75–80 saw increases across all measured percentiles. Median net worth rose from $389K to $488K (+25%), while the 25th percentile increased from $97K to $139K (+43%). This contrasts with younger households, where the bottom quartile and median generally experienced weaker outcomes.
What can we conclude?
The data suggests that the financial gap between typical households and wealthier households has widened, particularly among people in their 40s and 50s.
However, there are important limitations. These figures compare different households within the same age groups in 2022 and 2025, rather than tracking the same families over time.
About The Author
Alex Sukhanov, founder of Nauma, a financial planning platform built for people in tech and high-net-worth families. Alex previously worked at Google and started Nauma to help more people in tech make better financial decisions and achieve more in their lives. You can reach out to Alex on linkedin.
Nauma is supported entirely by its users: no commissions, no affiliate incentives, and no financial products to sell. Built as an independent software platform rather than a traditional advisory firm, Nauma is designed to give tech professionals the tools and modeling clarity to evaluate their own equity, tax, and retirement scenarios.