'%3e%3cpath%20d='M136%2043.0521C135.893%2043.4991%20131.298%2041.3697%20123.51%2041.5186C120.787%2041.5712%20109.626%2040.8001%20104.06%2049.4228C101.316%2053.664%20102.266%2056.2491%20100.601%2061.5769C95.2065%2078.8661%2087.7394%2075.1856%2062.5302%2088.5228C54.5058%2092.764%2045.1595%20101.562%2043.5589%20103.087C31.9403%20114.163%2025.1664%20123.189%2025.1521%20123.171C25.1378%20123.162%2034.1912%20104.357%2047.7676%2082.7655C60.6795%2062.2429%2063.8235%2070.0769%2079.7722%2049.1336C81.7015%2046.6011%2084.8526%2037.6805%2089.683%2036.1032C93.6345%2034.815%2098.6148%2036.6114%20100.065%2038.5568C101.044%2039.8712%20101.459%2040.765%20103.831%2040.4408C110.048%2039.5996%20113.613%2039.8625%20115.492%2039.7748C116.95%2039.7047%20119.751%2039.915%20120.509%2039.9939C130.419%2040.9753%20136.15%2042.4563%20136.007%2043.0434L136%2043.0521Z'%20fill='%23127398'/%3e%3cpath%20d='M22.1867%2043.6392C30.3968%2055.0923%2031.5544%2062.348%2040.6506%2068.6923C45.9954%2072.4253%2053.4839%2075.4134%2058.2928%2075.5361C61.9084%2075.6325%2063.7305%2075.2557%2064.6023%2074.949C64.8524%2074.8614%2065.1025%2074.8351%2065.3597%2074.8263L76.0636%2070.6727C76.8068%2066.8871%2076.1637%2063.4784%2076.1065%2063.1892C75.0561%2058.0103%2072.3337%2053.3835%2070.5402%2051.2542C55.4561%2033.3428%2055.8062%2034.298%2046.5814%2028.0237C26.7884%2014.5902%20-1.22192%2021.3464%200.0428309%2022.0562C0.55016%2022.3454%2010.2394%2026.9634%2022.1867%2043.6392Z'%20fill='%23127398'/%3e%3cpath%20d='M79.8366%2044.0161C81.33%2046.4784%2083.4093%2051.5784%2083.7666%2056.8975C83.7952%2057.3094%2084.1667%2064.0393%2080.4654%2068.4733C78.5004%2070.8217%2076.2281%2071.5403%2075.585%2071.7506C61.487%2076.5264%2028.4319%20116.196%2023.3515%20133.494C23.2229%20133.941%2022.6227%20136.026%2022.5655%20136C22.3797%20135.921%2023.5373%20120.753%2028.925%20106.303C28.925%20106.303%2033.7196%2090.5295%2046.7387%2073.9326C49.1896%2070.8042%2052.8052%2067.0362%2052.8052%2067.0362C54.2414%2065.1434%2059.8006%2068.3068%2066.1887%2068.482C69.9401%2068.5872%2073.2198%2067.6846%2073.2055%2067.3604C73.2055%2067.2377%2073.0698%2067.0712%2072.8911%2066.9047C72.3195%2066.3702%2071.5907%2066.1423%2070.8761%2066.2475C69.9758%2066.379%2068.1323%2066.3877%2064.5738%2065.5903C59.8435%2064.5212%2052.8481%2060.096%2048.0534%2055.364C39.9076%2047.3109%2039.7147%2039.9238%2033.1051%2026.9985C23.4944%208.17586%2014.0767%201.32328%2014.0767%201.32328C17.285%20-1.64734%2041.451%20-0.788575%2059.229%2016.3692C67.5177%2024.3697%2067.2962%2023.3619%2079.8366%2044.0073V44.0161Z'%20fill='%23EF9920'/%3e%3c/g%3e%3cdefs%3e%3cclipPath%20id='clip0_882_3310'%3e%3crect%20width='136'%20height='136'%20fill='white'/%3e%3c/clipPath%3e%3c/defs%3e%3c/svg%3e)
One of our users recently reached out with a question: They are working on their financial plan and currently have an approximately $500K+ withdrawal from a taxable account in 2037, but the model estimates $0 in taxes. This unusually low tax made them skeptical and they asked us to look at their financial plan together.
My first thought was that it’s a bug in our tax software unless the user already has or expects to generate significant capital loss carryover which would let them offset their 2037 capital gains and reduce their taxes.
And then we found an interesting insight which we all initially missed.
Current Situation
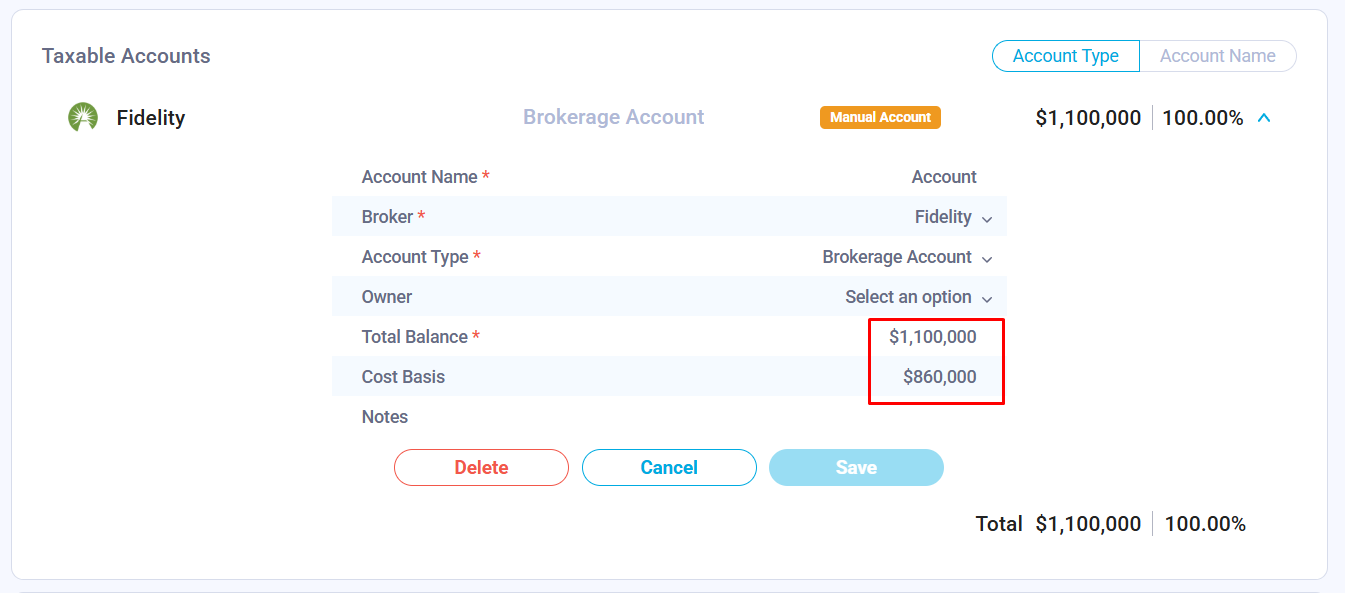
We started by reviewing their current assets. The total value of their taxable accounts was $1.1M, with a cost basis of $860K.
I normally check whether the cost basis is entered correctly for brokerage accounts before reviewing financial projections. Withdrawals from taxable accounts are generally taxed on the difference between the current value and the cost basis. If the cost basis is missing or entered incorrectly, the model may estimate long-term capital gains taxes incorrectly.
Not entering cost basis is one of the most common mistakes that can affect the model output. While it is technically possible to skip it, I recommend calculating and entering it whenever possible.
Cost basis needs to be entered only when accounts are added manually. Brokerage accounts connected through Plaid have their cost basis calculated automatically by Nauma.
Then we looked at their existing accumulated capital loss carryovers.
In the U.S., if your capital losses exceed your capital gains, you can generally use the excess loss to reduce ordinary income by up to $3,000 per year. Any remaining unused loss is carried forward to future years, where it can be used to reduce future capital gain income and taxes.
Short- and long-term capital losses are tracked separately. They are also tracked separately at the federal and state levels. Due to differences in state taxation, federal and state capital loss carryovers may diverge over time.
To review the current capital loss carryover, I went to Current Income & Expenses in the left menu, scrolled down, and clicked the Tax Settings button. The next page showed that the user did not have any capital loss carryover entered that could impact their future capital gains:

Financial Projection
A financial projection is where mistakes are easy to make, and even small errors can compound over time. That is why it is important to spend time reviewing the data and understanding the assumptions behind the projection.
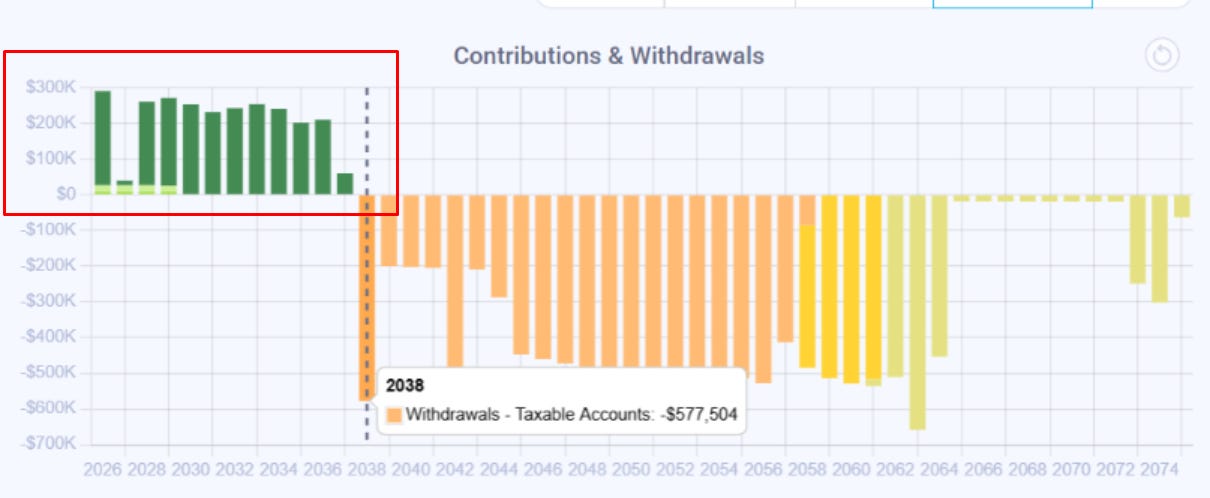
The user plans to save aggressively over the next 10 years, and their income supports that plan. In Nauma, all unallocated savings are directed to taxable accounts by default, shown as dark green bars. Based on the projection, their total taxable account contributions between 2026 and 2037 are $2.49M.
That increases the cost basis of their taxable accounts from the current $860K to $3.35M in 2037.
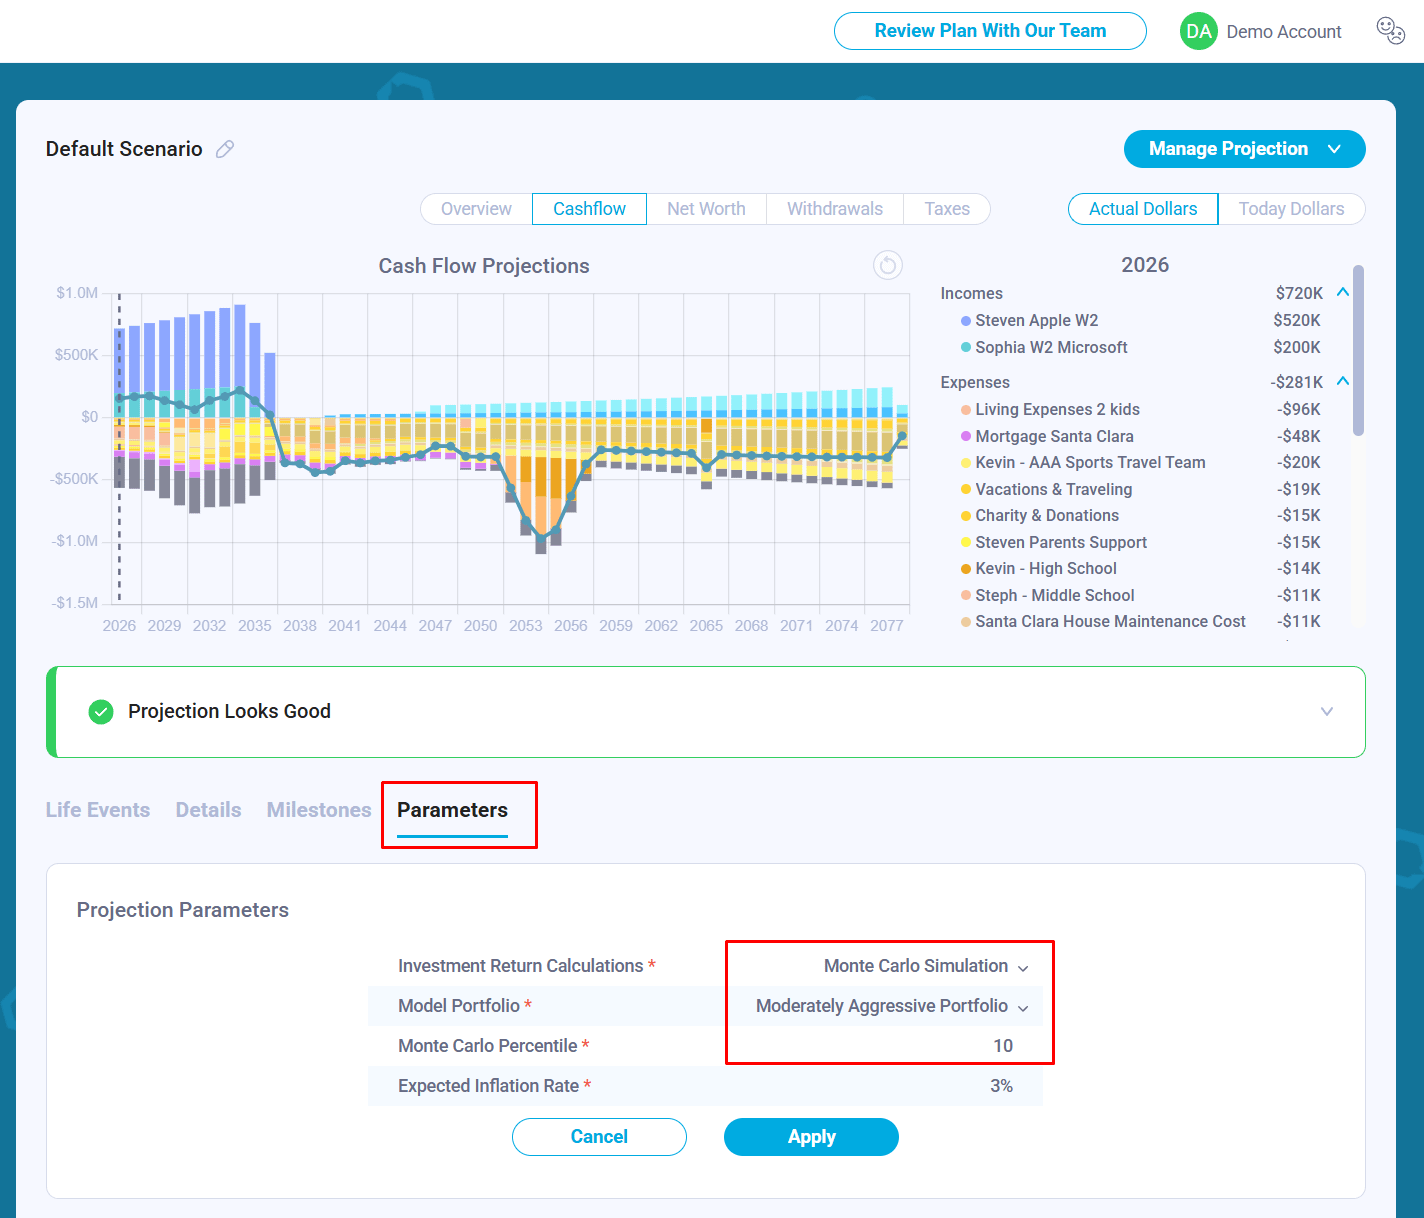
The projection uses Monte Carlo simulation to model investment returns. In this case, the user selected the bottom 10th percentile, which is a conservative assumption. It means that 90% of all simulation runs generated higher returns.
Nauma runs these simulations using the selected model portfolio and historical return data from 1992 to the present. Model portfolios are built using stocks represented by VTSMX, bonds represented by VBMFX, and cash represented by 3-month Treasury bills.
Demo account screenshot:
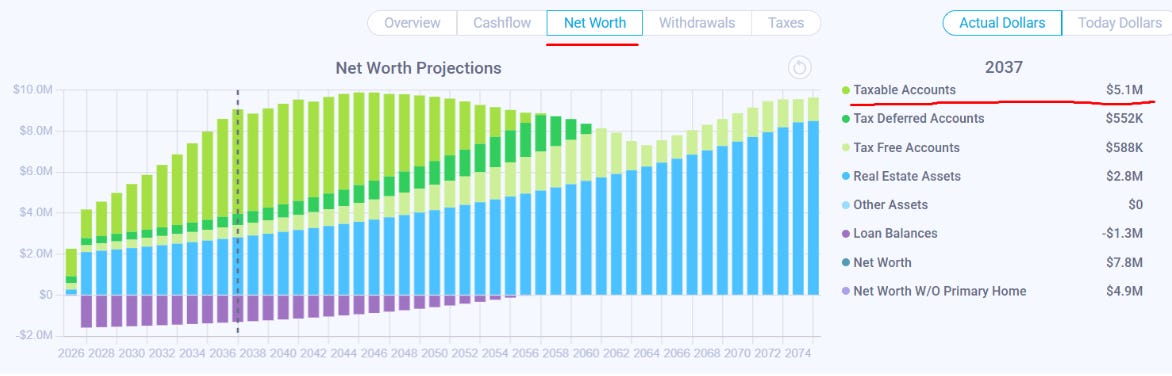
To see the total value of their taxable accounts, we went to the Net Worth tab and clicked the year we wanted to analyze. In this projection, the total value of their taxable accounts is expected to grow to $5.1M in 2037, with a cost basis of $3.35M, as estimated earlier:
When the $500K withdrawal happens in 2037, the model estimates the cost basis of that withdrawal as:
$500K × $3.35M / $5.1M = $328K
That means the realized gain is approximately:
$500K - $328K = $172K
At first glance, that gain appears high enough to create a tax bill. It is higher than today’s standard deduction plus the 0% long-term capital gains bracket:
$32,200 + $98,900 = $131,100
So, should they expect to pay taxes?
In this case, no.
The challenge with estimating income taxes in long-term financial projections is that the IRS adjusts tax brackets and the standard deduction for inflation every year. A $131.1K threshold today would be equivalent to approximately $181.4K in 2037, assuming 3% annual inflation.
As a result, the user’s estimated $172K realized gain is fully covered by the inflation-adjusted standard deduction and 0% long-term capital gains bracket in 2037.

Takeaway
The model applied inflation-adjustment logic to estimate the potential capital gains tax. However, it did not clearly communicate that logic to the user, which made the result feel suspicious.
To address this, we added a Tax Details button to help users review the assumptions behind the calculations and verify the results. To get there, click the Taxes tab and then the View Tax Details button.
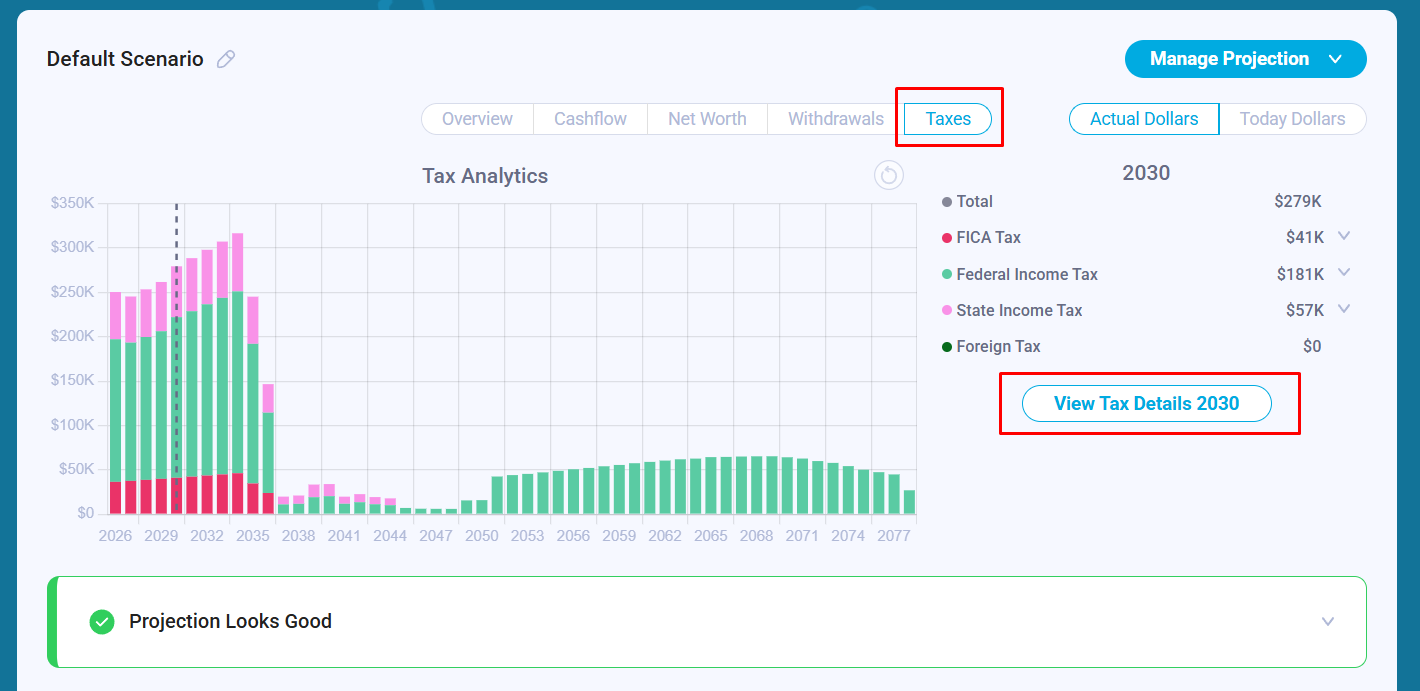
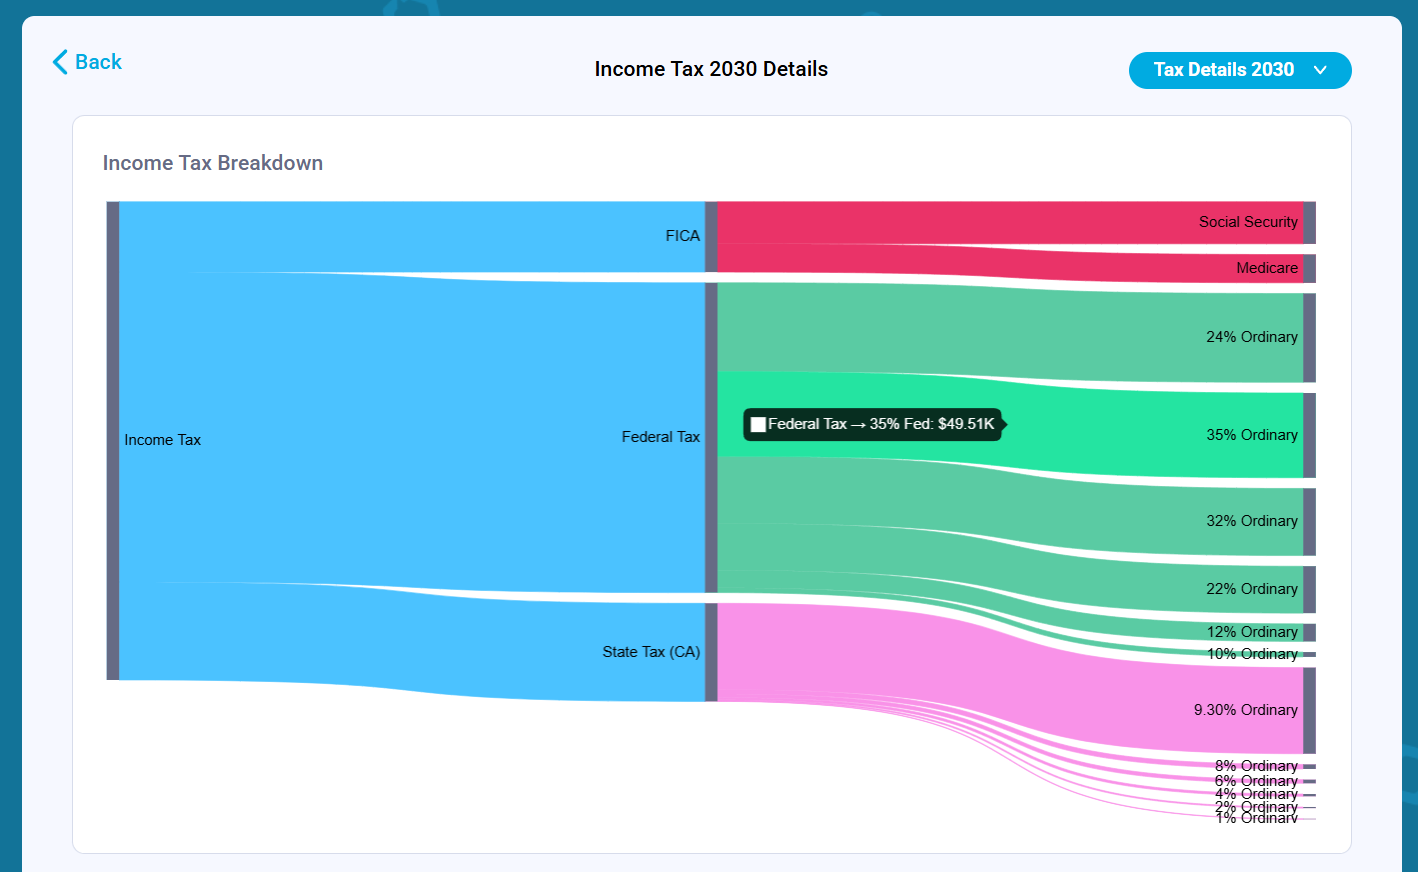
The button opens a new screen within a projection with a Sankey diagram. The diagram breaks down income taxes by category:
FICA Tax
Federal Tax
State Tax
Foreign Tax (if enabled)
For each tax category, it shows how much of each tax bracket is filled and how much tax is paid within that bracket in that specific year.
To make the assumptions easier to review, we also added tables below the Sankey diagram showing the standard deduction and the actual tax bracket ranges used by the model for that year.
Ordinary income and long-term capital gains tax brackets are shown separately because they follow different tax rules and thresholds. This makes it easier to understand how the model calculates taxable income, applies deductions, fills each bracket, and estimates the resulting tax liability.
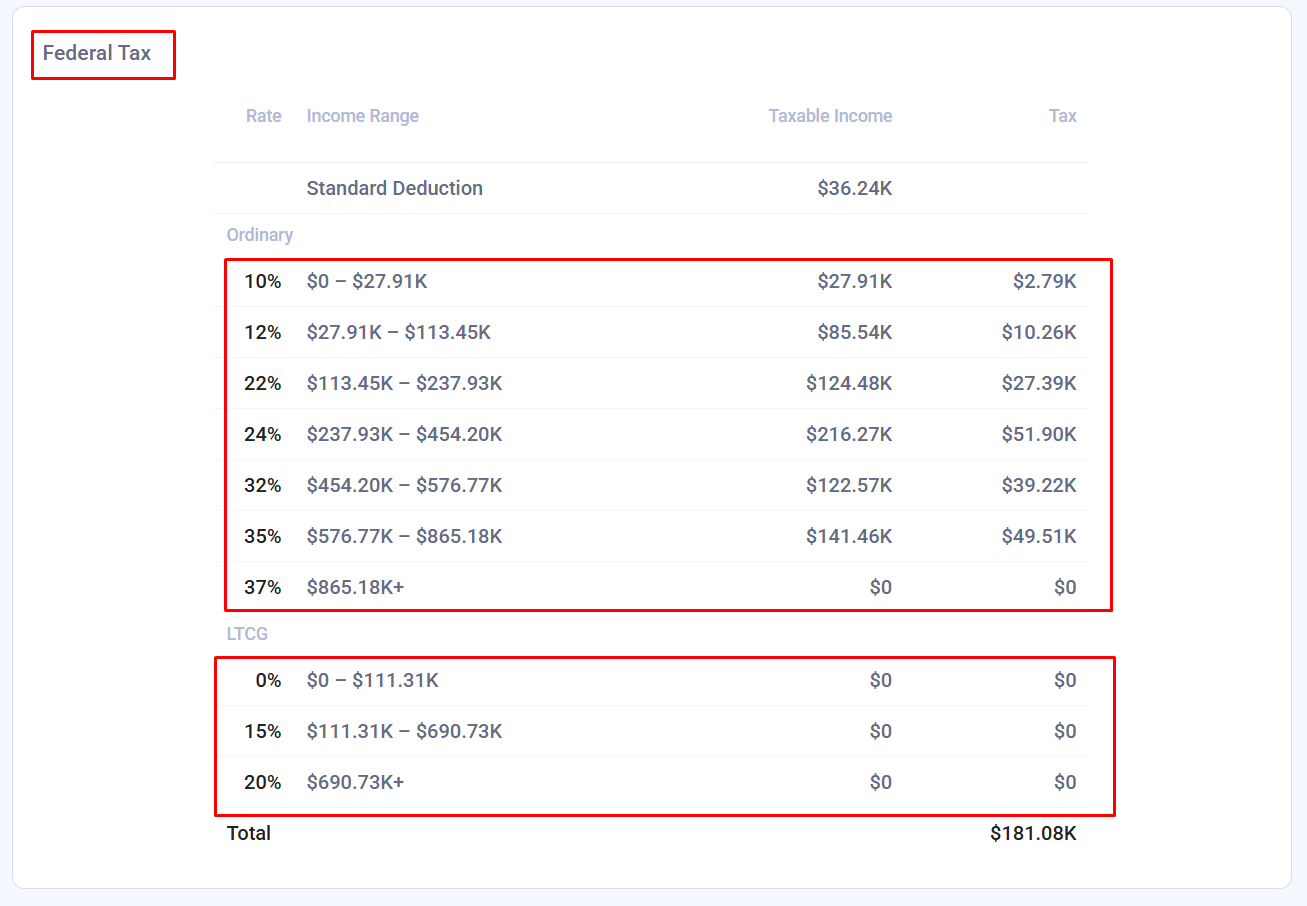
The same view is also available for state taxes.
Visualize Your Own Future
If you have been looking at your own projections and wondering whether the results are correct, you can now dive into the new Sankey diagrams and tax bracket tables in your Nauma account. Whether the model shows a $0 tax bill or a significant liability, you now have the tools to see exactly why those numbers exist.

About the Author: Alex Sukhanov, founder of Nauma, a financial planning platform built for people in tech and high-net-worth families. Alex previously worked at Google and started Nauma to help more people in tech make better financial decisions and achieve more in their lives. You can reach out to Alex on linkedin.
Nauma is supported entirely by its users with no commissions and no affiliate incentives. It is designed to give people clarity on taxes, equity compensation and retirement planning.
Disclaimer: Nauma projections are hypothetical and not guarantees of future results. Tax laws may change, and estimates may not reflect future legislative updates. This content is for educational purposes only and is not tax or investment advice.