'%3e%3cpath%20d='M136%2043.0521C135.893%2043.4991%20131.298%2041.3697%20123.51%2041.5186C120.787%2041.5712%20109.626%2040.8001%20104.06%2049.4228C101.316%2053.664%20102.266%2056.2491%20100.601%2061.5769C95.2065%2078.8661%2087.7394%2075.1856%2062.5302%2088.5228C54.5058%2092.764%2045.1595%20101.562%2043.5589%20103.087C31.9403%20114.163%2025.1664%20123.189%2025.1521%20123.171C25.1378%20123.162%2034.1912%20104.357%2047.7676%2082.7655C60.6795%2062.2429%2063.8235%2070.0769%2079.7722%2049.1336C81.7015%2046.6011%2084.8526%2037.6805%2089.683%2036.1032C93.6345%2034.815%2098.6148%2036.6114%20100.065%2038.5568C101.044%2039.8712%20101.459%2040.765%20103.831%2040.4408C110.048%2039.5996%20113.613%2039.8625%20115.492%2039.7748C116.95%2039.7047%20119.751%2039.915%20120.509%2039.9939C130.419%2040.9753%20136.15%2042.4563%20136.007%2043.0434L136%2043.0521Z'%20fill='%23127398'/%3e%3cpath%20d='M22.1867%2043.6392C30.3968%2055.0923%2031.5544%2062.348%2040.6506%2068.6923C45.9954%2072.4253%2053.4839%2075.4134%2058.2928%2075.5361C61.9084%2075.6325%2063.7305%2075.2557%2064.6023%2074.949C64.8524%2074.8614%2065.1025%2074.8351%2065.3597%2074.8263L76.0636%2070.6727C76.8068%2066.8871%2076.1637%2063.4784%2076.1065%2063.1892C75.0561%2058.0103%2072.3337%2053.3835%2070.5402%2051.2542C55.4561%2033.3428%2055.8062%2034.298%2046.5814%2028.0237C26.7884%2014.5902%20-1.22192%2021.3464%200.0428309%2022.0562C0.55016%2022.3454%2010.2394%2026.9634%2022.1867%2043.6392Z'%20fill='%23127398'/%3e%3cpath%20d='M79.8366%2044.0161C81.33%2046.4784%2083.4093%2051.5784%2083.7666%2056.8975C83.7952%2057.3094%2084.1667%2064.0393%2080.4654%2068.4733C78.5004%2070.8217%2076.2281%2071.5403%2075.585%2071.7506C61.487%2076.5264%2028.4319%20116.196%2023.3515%20133.494C23.2229%20133.941%2022.6227%20136.026%2022.5655%20136C22.3797%20135.921%2023.5373%20120.753%2028.925%20106.303C28.925%20106.303%2033.7196%2090.5295%2046.7387%2073.9326C49.1896%2070.8042%2052.8052%2067.0362%2052.8052%2067.0362C54.2414%2065.1434%2059.8006%2068.3068%2066.1887%2068.482C69.9401%2068.5872%2073.2198%2067.6846%2073.2055%2067.3604C73.2055%2067.2377%2073.0698%2067.0712%2072.8911%2066.9047C72.3195%2066.3702%2071.5907%2066.1423%2070.8761%2066.2475C69.9758%2066.379%2068.1323%2066.3877%2064.5738%2065.5903C59.8435%2064.5212%2052.8481%2060.096%2048.0534%2055.364C39.9076%2047.3109%2039.7147%2039.9238%2033.1051%2026.9985C23.4944%208.17586%2014.0767%201.32328%2014.0767%201.32328C17.285%20-1.64734%2041.451%20-0.788575%2059.229%2016.3692C67.5177%2024.3697%2067.2962%2023.3619%2079.8366%2044.0073V44.0161Z'%20fill='%23EF9920'/%3e%3c/g%3e%3cdefs%3e%3cclipPath%20id='clip0_882_3310'%3e%3crect%20width='136'%20height='136'%20fill='white'/%3e%3c/clipPath%3e%3c/defs%3e%3c/svg%3e)
What Is a Goal Funding Ratio?
Options to Consider When Your Financial Goals Are Not On Track — and How to Measure Where You Stand
A goal funding ratio is a measure of how funded a specific financial goal is today, expressed as the ratio of current assets allocated to that goal to the present value of the capital required to fully fund it. A ratio of 1.0 (100%) means the goal is exactly on track. A ratio below 1.0 means the goal is underfunded. A ratio above 1.0 means it is overfunded — there is more than enough capital, and the excess represents room to reduce risk or redirect resources elsewhere.
Unlike a single "retirement number" that tells you how much you need in total, the goal funding ratio tells you where you stand right now, relative to where you need to be. It transforms retirement planning from a binary pass/fail question into a continuous, trackable metric.
All examples in this article are hypothetical and provided for illustrative purposes only. Past performance does not guarantee future results. Individual results will vary.
The Formula
Goal Funding Ratio = Current Assets Allocated to the Goal ÷ Present Value of the Goal's Required Future Assets
The two components:
Current assets allocated to the goal — the portion of your savings, investments, or projected future contributions specifically assigned to fund this goal. In practice, this often includes existing retirement account balances, projected future contributions discounted back to today, and any other assets earmarked for this purpose.
Present value of the goal's required future assets — the amount you need in today's dollars to fully fund the goal. For a retirement goal, this is the total capital required at retirement to sustain your target spending through the end of your planning horizon, discounted back to today at a real return assumption.
What Different Ratios Mean
| Ratio | Status | What It Means |
|---|---|---|
| < 0.80 (< 80%) | Underfunded | Significant gap. Investors often consider options such as increasing savings, extending the timeline, reducing the goal target, or reviewing risk exposure. |
| 0.80–0.99 (80–99%) | Approaching on track | Mild shortfall. May resolve through continued contributions and compounding. Worth monitoring closely. |
| 1.00 (100%) | On track | Current assets, on the expected trajectory, are sufficient to fund the goal at the defined target. Investors often consider maintaining course. |
| 1.01–1.25 (101–125%) | Overfunded — modest surplus | May represent an opportunity to review risk exposure for this goal. Excess may be considered for other goals. |
| > 1.25 (> 125%) | Overfunded — significant surplus | Goal is substantially over-capitalized. May represent an opportunity to reduce risk, redirect surplus, or revisit the goal target. |
Worked Example: Retirement Goal for a Tech Worker
The following example is hypothetical and intended solely for illustrative purposes. It does not constitute a recommendation regarding asset allocation or financial planning strategy.
Maya is 48 years old and works as a senior engineer in the Bay Area. Her retirement goal is:
- Target spending: $15,000 per month in today's dollars
- Retirement start date: age 62 (14 years from now)
- Planning horizon: through age 95 (a commonly used planning horizon to account for longevity risk)
- Goal type: Non-discretionary for the first $10,000/month; discretionary above that
Calculating the present value of Maya's retirement goal:
Her annual retirement spending target is $180,000 in today's dollars. Sustained over 33 years with inflation adjustments and a real return assumption applied to the remaining portfolio, the total capital required at the start of retirement is approximately $4.5 million in today's dollars. Discounted back 14 years to today at a real rate of 3.5%, the present value of that capital requirement is approximately $3.0 million.
Maya currently has $2.4 million in retirement accounts and brokerage assets allocated to retirement.
Her goal funding ratio today: $2.4M ÷ $3.0M = 0.80 (80%).
She is approaching on track on a current-assets-only basis. When her planned contributions of $80,000 per year over the next 14 years are included in the calculation, her projected assets at retirement exceed the target — putting her on track overall, with meaningful probability of success in Monte Carlo modeling.
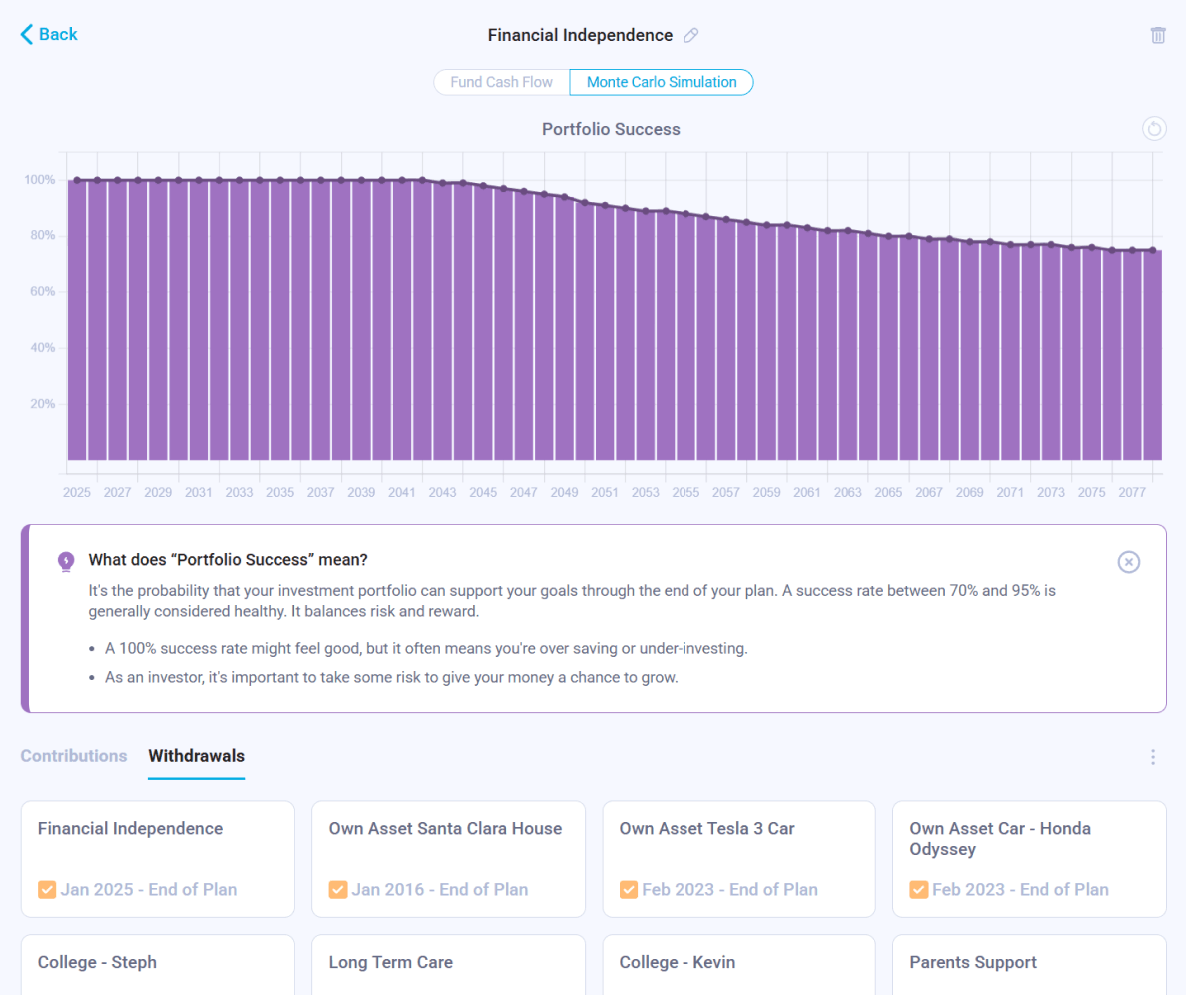
Nauma calculates both views: the current funding ratio (assets today vs. goal present value today) and the projected funding ratio (expected future assets vs. goal target), with confidence intervals from Monte Carlo simulation.
Goal Funding Ratio vs. Monte Carlo Probability of Success
These two metrics answer different questions and work best together.
| Goal Funding Ratio | Monte Carlo Probability of Success |
|---|---|
| How funded is this goal right now? | What is the probability this goal gets funded across all simulated scenarios? |
| A snapshot metric — deterministic | A distribution metric — probabilistic |
| Identifies which goal is most underfunded | Shows how much uncertainty exists around a goal's outcome |
| Does not model market uncertainty | Explicitly models sequence of returns, volatility, and tail risks |
| Immediately intuitive | Requires interpretation (what does 78% mean in practice?) |
A goal with a funding ratio above 1.0 may still show a lower-than-expected Monte Carlo probability if it relies on volatile assets and a tight timeline. Both metrics together give you the complete picture: where you are now, and what the range of outcomes looks like going forward.
See What Is Monte Carlo Simulation? for how probability of success is calculated and what it means for your plan.
Using Goal Funding Ratio to Prioritize Between Goals
The goal funding ratio is most powerful when calculated for all goals simultaneously. Looking at the ratios side by side immediately reveals which goal is most underfunded, which has the tightest timeline, and where the next savings dollar has the highest impact.
A 47-year-old tech worker who calculates funding ratios for all of their goals might find:
| Goal | Funding Ratio | Urgency |
|---|---|---|
| Retirement (non-discretionary floor, target age 60) | 0.71 | High — 13 years, large gap |
| Retirement (discretionary spending, target age 60) | 0.55 | High — same timeline, large gap |
| College funding (child 1, 6 years) | 0.82 | Medium-high — short timeline |
| College funding (child 2, 9 years) | 0.91 | Medium — reasonable timeline |
| Mortgage payoff (7 years) | 0.96 | Low — nearly funded |
| Legacy goal | 0.40 | Low urgency — no deadline |
The retirement non-discretionary floor and college funding for child 1 are the most underfunded goals with the tightest timelines. The legacy goal is severely underfunded, but has no deadline — it can wait. The mortgage is nearly funded. This ordering makes visible which goals are most underfunded relative to their timelines — and where additional capital may have the most impact.
See How to Prioritize Competing Financial Goals for a full framework for goal prioritization using funding ratios.
This article is for educational purposes only and does not constitute legal, tax, or financial advice. The examples and calculations presented are hypothetical and for illustrative purposes only. Past performance does not guarantee future results. Always consult a qualified financial planner before making decisions about your financial goals or savings strategy. Tax treatment depends on individual circumstances and may be subject to change.
Frequently Asked Questions
See Your Goal Funding Ratio in Nauma
Nauma calculates your funding ratio for each goal and shows you how it changes with different contribution, return, and timeline assumptions — in real time.
Get Started for Free