'%3e%3cpath%20d='M136%2043.0521C135.893%2043.4991%20131.298%2041.3697%20123.51%2041.5186C120.787%2041.5712%20109.626%2040.8001%20104.06%2049.4228C101.316%2053.664%20102.266%2056.2491%20100.601%2061.5769C95.2065%2078.8661%2087.7394%2075.1856%2062.5302%2088.5228C54.5058%2092.764%2045.1595%20101.562%2043.5589%20103.087C31.9403%20114.163%2025.1664%20123.189%2025.1521%20123.171C25.1378%20123.162%2034.1912%20104.357%2047.7676%2082.7655C60.6795%2062.2429%2063.8235%2070.0769%2079.7722%2049.1336C81.7015%2046.6011%2084.8526%2037.6805%2089.683%2036.1032C93.6345%2034.815%2098.6148%2036.6114%20100.065%2038.5568C101.044%2039.8712%20101.459%2040.765%20103.831%2040.4408C110.048%2039.5996%20113.613%2039.8625%20115.492%2039.7748C116.95%2039.7047%20119.751%2039.915%20120.509%2039.9939C130.419%2040.9753%20136.15%2042.4563%20136.007%2043.0434L136%2043.0521Z'%20fill='%23127398'/%3e%3cpath%20d='M22.1867%2043.6392C30.3968%2055.0923%2031.5544%2062.348%2040.6506%2068.6923C45.9954%2072.4253%2053.4839%2075.4134%2058.2928%2075.5361C61.9084%2075.6325%2063.7305%2075.2557%2064.6023%2074.949C64.8524%2074.8614%2065.1025%2074.8351%2065.3597%2074.8263L76.0636%2070.6727C76.8068%2066.8871%2076.1637%2063.4784%2076.1065%2063.1892C75.0561%2058.0103%2072.3337%2053.3835%2070.5402%2051.2542C55.4561%2033.3428%2055.8062%2034.298%2046.5814%2028.0237C26.7884%2014.5902%20-1.22192%2021.3464%200.0428309%2022.0562C0.55016%2022.3454%2010.2394%2026.9634%2022.1867%2043.6392Z'%20fill='%23127398'/%3e%3cpath%20d='M79.8366%2044.0161C81.33%2046.4784%2083.4093%2051.5784%2083.7666%2056.8975C83.7952%2057.3094%2084.1667%2064.0393%2080.4654%2068.4733C78.5004%2070.8217%2076.2281%2071.5403%2075.585%2071.7506C61.487%2076.5264%2028.4319%20116.196%2023.3515%20133.494C23.2229%20133.941%2022.6227%20136.026%2022.5655%20136C22.3797%20135.921%2023.5373%20120.753%2028.925%20106.303C28.925%20106.303%2033.7196%2090.5295%2046.7387%2073.9326C49.1896%2070.8042%2052.8052%2067.0362%2052.8052%2067.0362C54.2414%2065.1434%2059.8006%2068.3068%2066.1887%2068.482C69.9401%2068.5872%2073.2198%2067.6846%2073.2055%2067.3604C73.2055%2067.2377%2073.0698%2067.0712%2072.8911%2066.9047C72.3195%2066.3702%2071.5907%2066.1423%2070.8761%2066.2475C69.9758%2066.379%2068.1323%2066.3877%2064.5738%2065.5903C59.8435%2064.5212%2052.8481%2060.096%2048.0534%2055.364C39.9076%2047.3109%2039.7147%2039.9238%2033.1051%2026.9985C23.4944%208.17586%2014.0767%201.32328%2014.0767%201.32328C17.285%20-1.64734%2041.451%20-0.788575%2059.229%2016.3692C67.5177%2024.3697%2067.2962%2023.3619%2079.8366%2044.0073V44.0161Z'%20fill='%23EF9920'/%3e%3c/g%3e%3cdefs%3e%3cclipPath%20id='clip0_882_3310'%3e%3crect%20width='136'%20height='136'%20fill='white'/%3e%3c/clipPath%3e%3c/defs%3e%3c/svg%3e)
What Is a Sustainable Withdrawal Rate?
The Research Behind the 4% Rule, Its Limitations for High-Income Early Retirees, and How to Think About Your Own Number
A sustainable withdrawal rate is the percentage of a portfolio that a retiree can withdraw each year — adjusted annually for inflation — without depleting the portfolio over a defined retirement horizon. It is the foundational question of retirement income planning: given what I have saved, how much can I actually spend each year?
The concept gained widespread attention through two landmark studies: William Bengen's 1994 paper in the Journal of Financial Planning, and the "Trinity Study" published in 1998 by three professors at Trinity University. Both reached a similar conclusion using historical US market data: a starting withdrawal rate of approximately 4% of the initial portfolio balance, adjusted annually for inflation, had survived all historical 30-year retirement periods when the portfolio was invested in a mix of equities and bonds.
This became the 4% rule — perhaps the most cited number in personal finance.
What the 4% Rule Actually Says
The 4% rule is more specific than it is often presented. In its original form, it describes a starting withdrawal rate — not an ongoing percentage. The mechanics are:
Year 1: withdraw 4% of the initial portfolio balance. If the portfolio is $2,000,000, withdraw $80,000.
Year 2: withdraw the same $80,000 plus inflation. If inflation was 3%, withdraw $82,400.
Year 3: withdraw $82,400 plus that year's inflation rate. And so on.
The withdrawal amount in dollar terms grows with inflation each year, regardless of portfolio performance. The 4% figure is only the starting percentage — in subsequent years, the actual withdrawal percentage of the current portfolio value will be higher (if the portfolio has declined) or lower (if it has grown).
This distinction matters: the 4% rule does not mean "withdraw 4% of whatever the portfolio is worth each year." That would be a dynamic withdrawal strategy. The 4% rule is a fixed real dollar withdrawal, starting at 4% of the initial balance.
Bengen's original research used a 50% equity / 50% bond portfolio and a 30-year retirement horizon. At those parameters, a 4% starting rate survived every historical 30-year period in US market data going back to 1926. The Trinity Study confirmed this using a broader range of portfolio allocations and time horizons.
Where the 4% Rule Holds — and Where It Breaks Down
The 4% rule provides a useful historical reference point, but several of its underlying assumptions may not apply to every retiree.
30-year horizon assumption. The original research targeted a 30-year retirement — roughly age 65 to 95. A retiree who stops working at 48 may face a 45–50 year horizon. Historical research suggests that 4% becomes significantly more stressful over longer periods: the success rate over 40-year periods in historical data is substantially lower than over 30-year periods. Research published by Wade Pfau and others suggests that a 3.0–3.5% starting rate has historically been more appropriate for 40-year planning horizons.
US market historical returns. Bengen's research and the Trinity Study used historical US equity market returns, which have been among the highest of any major market over the periods studied. Researchers including Michael Kitces and Wade Pfau have noted that forward-looking return expectations — based on current equity valuations and starting bond yields — may be lower than historical averages, which could reduce sustainable withdrawal rates from historical levels.
Fixed withdrawal rigidity. The rule assumes fixed, inflation-adjusted withdrawals regardless of portfolio performance. As discussed in the section on sequence of return risk below, this rigidity is the mechanism by which bad early returns become devastating. In periods of elevated or persistent inflation, the dollar withdrawal rises faster than expected, placing additional stress on the portfolio beyond what historical averages suggest. Dynamic withdrawal strategies address this limitation by allowing modest spending adjustments based on portfolio condition. See What Is Dynamic Withdrawal? for how these approaches work — and why even a 10% spending reduction in a severe downturn can meaningfully extend portfolio survival.
No taxes or advisor fees. The original research was conducted on pre-tax returns with no advisory costs. A retiree paying 1% in annual advisory fees, or facing significant taxes on required minimum distributions (which begin at age 73 for those born 1951–1959, or age 75 for those born in 1960 or later, under the SECURE 2.0 Act) from a large traditional IRA, is effectively operating at a higher withdrawal rate than the nominal 4%.
No other income sources. The research modeled a portfolio-only income scenario. Most retirees also receive Social Security, which meaningfully reduces the portfolio withdrawal burden. A retiree with $60,000 in annual Social Security income who needs $120,000 in total spending is withdrawing only $60,000 from the portfolio — a 3% withdrawal rate on a $2,000,000 portfolio rather than 6%. The sustainable withdrawal rate concept applies to the portfolio withdrawal component, not to total retirement income.
What Rate Is Appropriate for Different Situations?
There is no single correct sustainable withdrawal rate — it depends on time horizon, portfolio composition, the presence of other income sources, and the degree of spending flexibility the retiree is willing to exercise.
The following provides general reference ranges from published research. These are not personalized recommendations and do not account for individual circumstances:
| Planning Horizon | Historical Reference Range | Notes |
|---|---|---|
| 30 years | 4.0–4.5% | Original Bengen/Trinity research; US historical data |
| 35 years | 3.5–4.0% | Increased failure risk at 4% over longer periods |
| 40 years | 3.0–3.5% | Appropriate for early retirees; significant uncertainty |
| 45–50 years | 2.5–3.0% | Very early retirement; historically rare; high uncertainty |
These ranges are drawn from academic research using historical market data and do not represent guarantees or predictions of future results. Actual sustainable rates depend on future market conditions, which are inherently uncertain.
A retiree with substantial guaranteed income (Social Security covering most essential expenses), meaningful spending flexibility (willingness to reduce discretionary spending in down years), and a diversified portfolio may comfortably sustain a higher effective portfolio withdrawal rate. A retiree with a 50-year horizon, all expenses funded by portfolio withdrawals, and no spending flexibility requires a more conservative rate.
The Interaction With Sequence of Return Risk
The sustainable withdrawal rate is not independent of when bad returns occur. This is the core of sequence of return risk: two portfolios with identical 30-year average returns can produce dramatically different outcomes depending on when the losses occur.
If a portfolio declines 35% in the first two years of retirement while withdrawals continue at the planned dollar amount, the portfolio has been severely impaired. The same 35% loss occurring in year 20 of retirement — when the portfolio is smaller and the remaining horizon is shorter — has a far smaller impact on the plan's success.
This asymmetry means the sustainable withdrawal rate concept assumes an average experience across many historical sequences. For any specific retiree, the actual sustainable rate will be determined by the sequence they experience — which is unknown in advance. Dynamic withdrawal strategies and cash reserves (the bucket strategy's first bucket) are the primary practical tools for managing this uncertainty without requiring the retiree to accept a permanently lower withdrawal rate. See What Is Sequence of Return Risk? and What Is the Bucket Strategy? for how these strategies address sequence uncertainty.
The Role of Monte Carlo Simulation
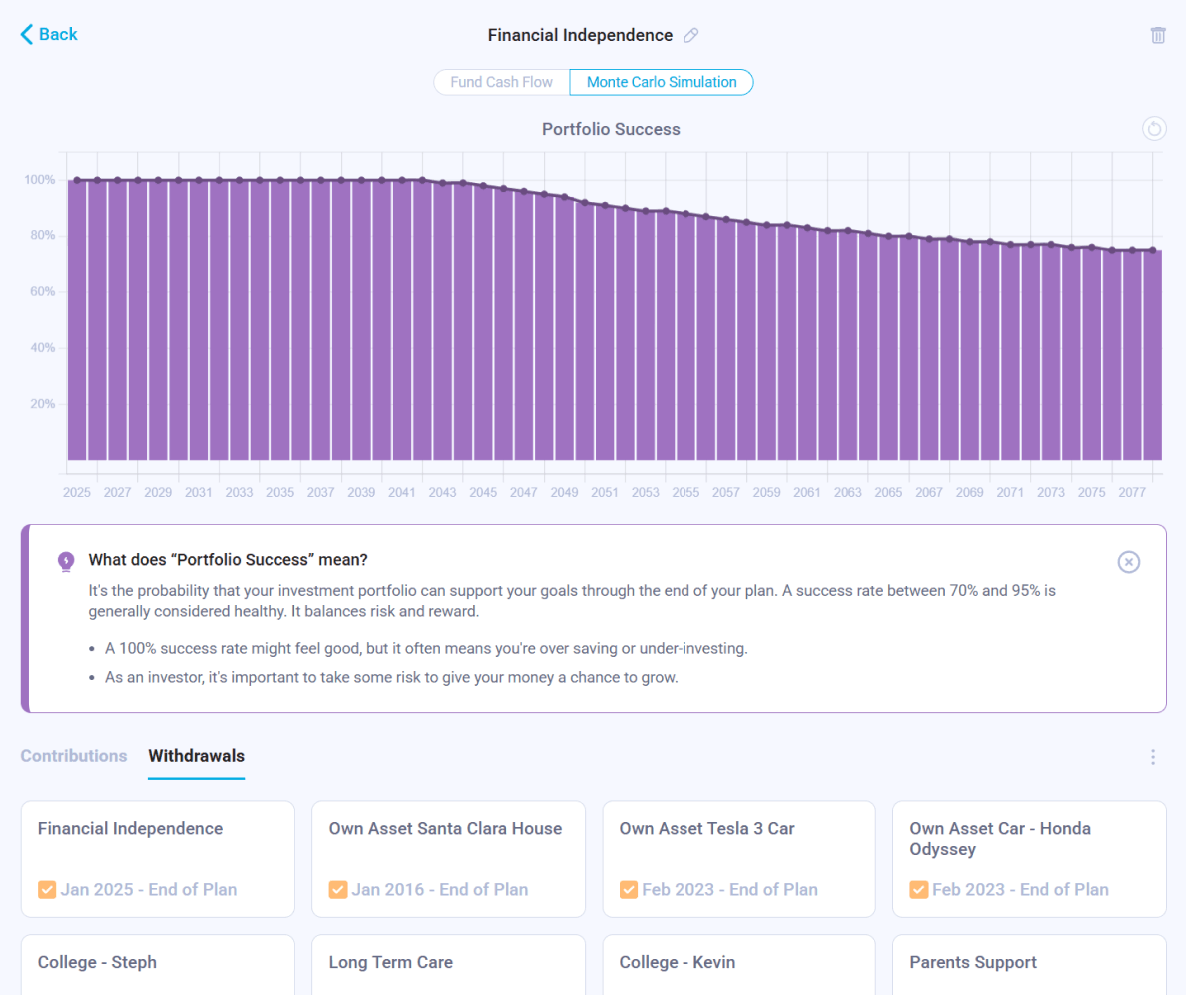
The most rigorous way to evaluate a specific withdrawal rate against a specific portfolio and planning horizon is Monte Carlo simulation. Rather than relying on historical sequences, Monte Carlo generates thousands of randomized return scenarios and calculates what percentage of them result in the portfolio surviving to the end of the planning horizon.
A "90% probability of success" from Monte Carlo simulation means that in 90 out of 100 simulated scenarios, the portfolio was not depleted before the end of the plan. A 70% probability of success means 30 out of 100 scenarios resulted in depletion. Neither is inherently right or wrong — the appropriate target depends on the retiree's flexibility, other income sources, and willingness to adjust spending if results trend toward the less favorable scenarios.
An important caveat: Monte Carlo simulation is a modeling tool based on statistical assumptions — it is not a forecast of future market returns. Its output is only as reliable as its inputs (assumed return distributions, volatility, correlations), and real-world markets can behave in ways that fall outside the model's parameters. Probability of success figures should be interpreted as scenario analysis, not predictions.
The connection between the sustainable withdrawal rate concept and Monte Carlo is direct: Monte Carlo simulation is the tool that translates a specific rate into a probability of success for a specific situation. See What Is Monte Carlo Simulation? for how these simulations work and how to interpret the output.
This article is for educational purposes only and does not constitute investment, tax, or financial advice. It is intended for a US audience; tax treatment, account structures, and regulatory frameworks differ significantly in other jurisdictions. Historical research on sustainable withdrawal rates uses past market data and does not guarantee future results. RMD age thresholds referenced are based on current US law (SECURE 2.0 Act) and may be subject to future legislative changes. Individual circumstances — including time horizon, other income sources, spending needs, and risk tolerance — significantly affect what withdrawal rate may be appropriate. Always consult a qualified financial advisor before making retirement income decisions.
Frequently Asked Questions
Model Your Withdrawal Rate Against Your Actual Plan
Nauma runs your specific portfolio, income sources, and spending across thousands of Monte Carlo scenarios — so you can see what withdrawal rate gives you the probability of success that makes sense for your situation.
Get Started for Free